Water stress
66.5%
Country Water Profile
SDG 6.4.2 water stress: 66.5% · WRI Aqueduct baseline water stress: Extremely High (>80%) · At least basic drinking water: 95.7% · Drought exposure: Medium - High (0.6-0.8)
India has 66.5% SDG 6.4.2 water stress in the latest available FAO AQUASTAT reading, while WRI Aqueduct classifies baseline water stress as Extremely High (>80%). WHO/UNICEF JMP estimates at least basic drinking-water access at 95.7% and safely managed drinking water at 76.4%. WRI Aqueduct adds a baseline drought exposure signal of Medium - High (0.6-0.8).
India’s water risk is long-term and structural, driven mainly by high water stress, agricultural demand, drought exposure, and groundwater pressure.
Water stress
66.5%
Basic drinking water
95.7%
Agricultural water use
90.4%
Population
1.5B
Aqueduct category
Extremely High (>80%)
Key Takeaway
India’s water risk is a long-term structural challenge shaped by high water stress, agriculture-led demand, drought exposure, groundwater pressure, and uneven drinking-water service quality. Basic drinking water access is widespread, but India still faces important risks around irrigation demand, climate variability, groundwater use, service reliability, and long-term water security.
Key Indicators
Water Stress
66.5%
Basic Drinking Water Access
95.7%
Agricultural Water Use
90.4%
Population
1.5B
Visual summary
A visual summary of India water stress, drinking-water access, agricultural water use, drought exposure, groundwater pressure, sanitation, and urban-rural service quality.
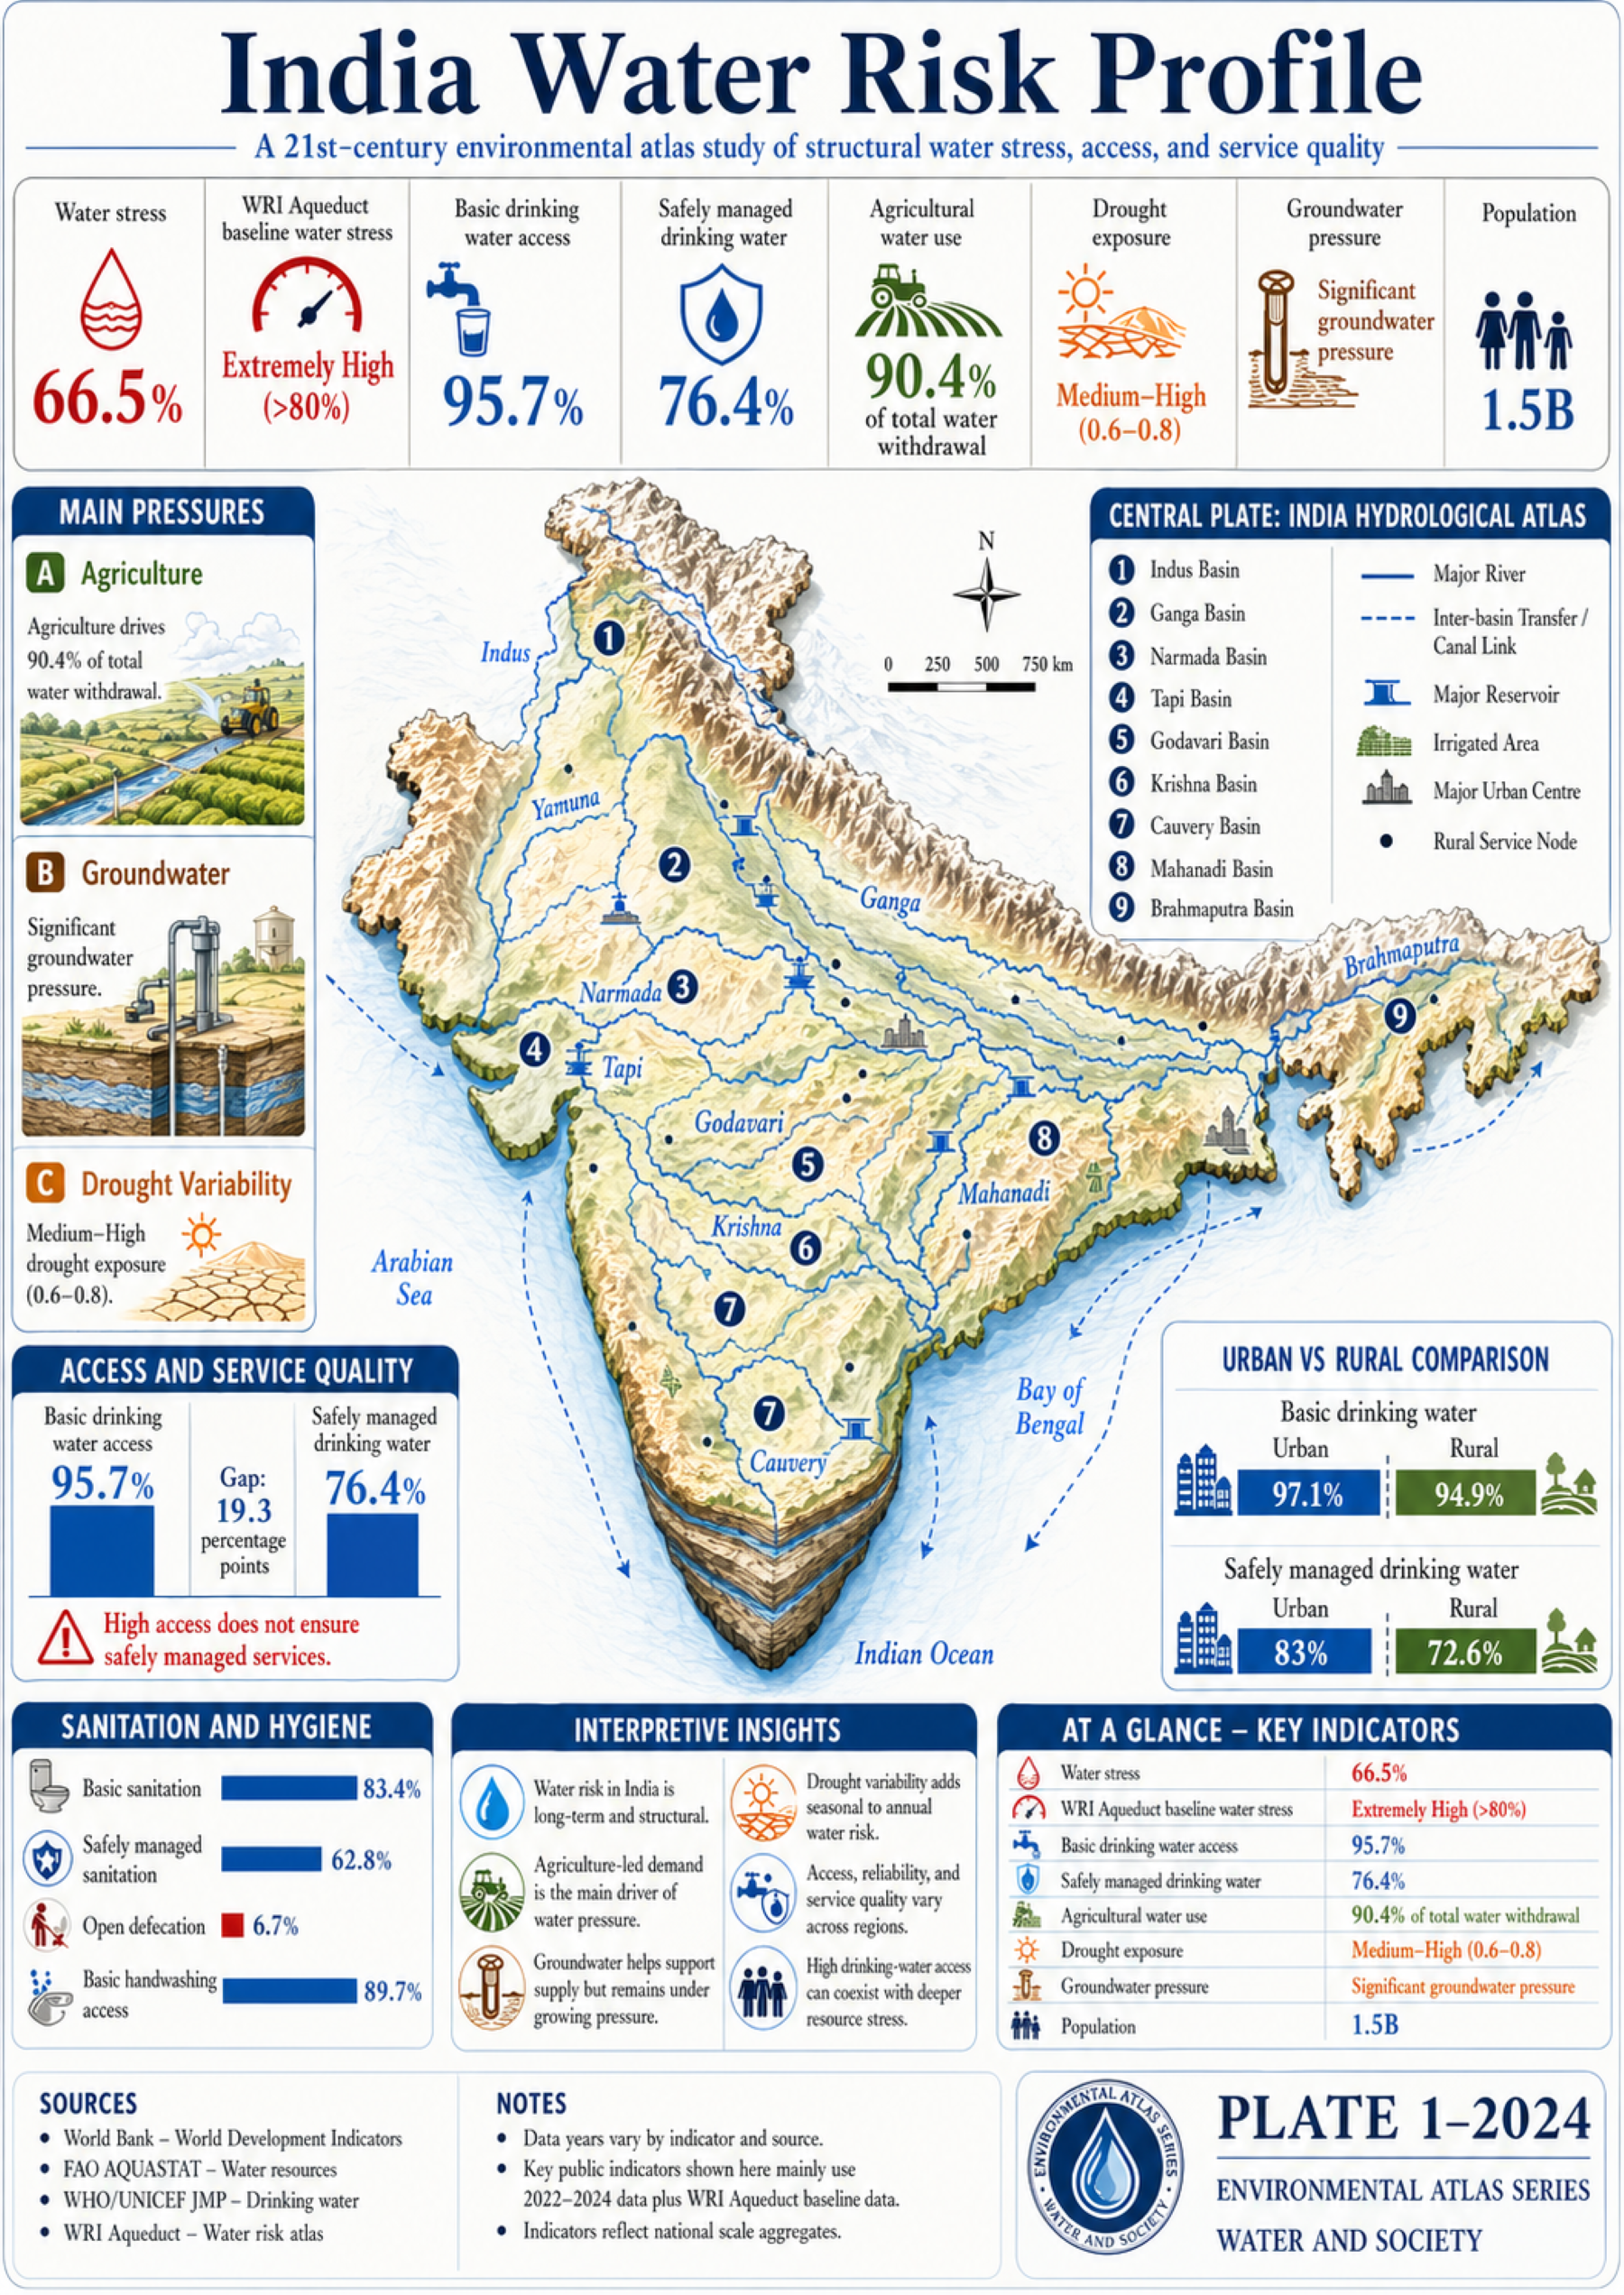
Water Access and Service Quality
This section brings together headline access, service quality, sanitation, hygiene, and the biggest access gaps.
The latest public indicators show 66.5% water stress, suggesting that pressure is not just episodic but tied to long-term demand, supply limits, and wider resource management.
Agriculture accounts for 90.4% of total water withdrawal, making it the single most important driver of national water pressure and a key factor in long-term system strain.
Basic drinking water access reaches 95.7%, but high access does not remove underlying resource stress, because reliability, service quality, and regional differences can still remain significant.
A drought exposure rating of Medium - High (0.6-0.8) means climate variability remains an important part of the national risk picture and can turn existing pressure into sharper disruption during dry periods.
Headline access figures do not tell the whole story. This breakdown shows how baseline access, service quality, and urban-rural differences shape the real picture.
Basic access
95.7%
Safely managed
76.4%
Shows the share of the population with a higher-quality drinking water service than basic access alone.
Shows whether sanitation access keeps pace with drinking water access and whether service quality remains uneven.
Helps show whether sanitation access gaps still translate into major health and dignity risks.
Adds hygiene context and helps show whether household-level service conditions support public health resilience.
Shows whether headline access hides a meaningful urban-rural inequality.
Shows whether service quality gaps remain sharper outside cities even when basic access is relatively high.
The most useful signals often sit in the gaps between access, service quality, geography, and resource pressure.
The gap between basic access and safely managed service shows where headline access still overstates full service quality.
Comparing water stress with access helps show whether infrastructure outcomes are masking deeper resource pressure.
Overview
India shows 66.5% SDG 6.4.2 water stress in the latest FAO AQUASTAT reading. The SDG threshold band is Medium (SDG 6.4.2 threshold). This percentage-based SDG indicator should be interpreted separately from WRI Aqueduct’s baseline water-stress category, which classifies India as Extremely High (>80%).
Basic drinking water access is 95.7%, while service quality and reliability can still vary below headline access figures.
Drought exposure is classified as Medium - High (0.6-0.8), while groundwater pressure is described as significant groundwater pressure. Together these factors can make water stress harder to manage across seasons and regions.
Water Data Snapshot
These indicators show where water pressure comes from, how it affects access, and how each metric should be interpreted in context.
| Indicator | Value | Source | Year | What it means |
|---|---|---|---|---|
| Population | 1.5B | World Bank | 2025 | Shows the scale of demand that water systems must serve. |
| Water stress | 66.5% | FAO AQUASTAT | 2022 | Shows how much pressure water withdrawals place on available resources. |
| Basic drinking water access | 95.7% | WHO/UNICEF JMP | 2024 | Shows how many people have at least basic drinking water access, but not full service quality on its own. |
| Agricultural water use share | 90.4% | FAO AQUASTAT | 2022 | Shows how strongly national water demand is concentrated in agriculture. |
| Drought exposure | Medium - High (0.6-0.8) | WRI Aqueduct | Baseline | Shows how strongly climate variability can intensify water supply pressure. |
| Groundwater pressure | Significant groundwater pressure | FAO AQUASTAT | 2022 | Shows how strongly the country depends on stressed groundwater resources. |
| Aqueduct water stress category | Extremely High (>80%) | WRI Aqueduct | Baseline | Shows WRI’s comparative risk category and should not be read as the same metric as FAO water stress %. |
| SDG 6.4.2 threshold band | Medium (SDG 6.4.2 threshold) | FAO AQUASTAT / SDG 6.4.2 | Shows the SDG threshold band only; interpret it separately from WRI Aqueduct baseline water stress, which classifies India as Extremely High (>80%). |
Main Pressures
This section combines the main drivers, pressure points, visible effects, and key takeaways.
Agriculture is a major driver of water demand, accounting for 90.4% of total water withdrawal. This increases sensitivity to irrigation demand, rainfall variability, and seasonal shortages.
Groundwater pressure is significant in several regions, which means underground water reserves remain an important support system but also a growing long-term constraint where demand stays high.
Drought exposure is elevated, which increases vulnerability to rainfall variability, supply disruption, and longer dry periods.
India faces sustained water strain because agriculture, households, cities, and industry all compete for limited freshwater resources. With national water stress at 66.5%, high demand is not only a dry-season problem; it is a structural part of India’s long-term water-risk profile.
Agriculture is the main driver of India’s water demand, accounting for 90.4% of total water withdrawals. This keeps irrigation needs high and makes farming one of the biggest forces behind India’s long-term water stress, especially in regions that depend on seasonal rainfall, groundwater, or large-scale irrigation systems.
Drought exposure and climate variability make India’s water supply less reliable during dry periods. In an already stressed system, drought can increase strain on irrigation, drinking-water reliability, groundwater reserves, and regional water security rather than acting as a short-term shock alone.
Groundwater helps balance India’s water supply where rainfall and surface water do not always meet demand. It supports farms, households, and cities, but heavy extraction can turn groundwater into a long-term constraint when use exceeds natural recharge.
High basic drinking water access does not remove India’s water risk. Service quality, reliability, geography, and safely managed drinking water coverage can still vary, meaning water systems may remain uneven and vulnerable where supply is intermittent, infrastructure is weak, or water quality is difficult to maintain.
Water stress shows up through competing demand across agriculture, households, industry, and ecosystems.
Drinking water pressure shows up through access, quality, reliability, and service differences between places and populations.
Drought and climate variability amplify water pressure by reducing supply reliability and increasing seasonal exposure.
With water stress at 66.5%, pressure on available water resources is high enough to shape the broader national water picture, not just isolated local shortages.
Basic drinking water access at 95.7% does not remove underlying water risk, because service quality, reliability, and regional differences can still remain significant under high system pressure.
Agricultural water use at 90.4% shows that farming remains the dominant driver of national water demand and a major source of long-term pressure on water systems.
A drought exposure rating of Medium - High (0.6-0.8) means climate variability can intensify existing stress and make dry periods more disruptive for supply and reliability.
Long-Term Story
This section combines trend evidence, forward-looking signals, and the broader country narrative.
Trend summary
India shows a persistent need to manage water demand, service resilience, and climate-related supply variability together.
Across public datasets, the overall picture is one of overlapping stress: demand pressures, uneven service outcomes, and climate-linked variability all contribute to the water risk profile.
Most people in India have access to at least basic drinking water, but basic access does not always mean the service is fully safe, reliable, or continuously available. This metric should be read together with safely managed drinking water access.
India’s water stress is high, meaning freshwater withdrawals place strong pressure on available water resources. This makes water stress one of the clearest signals of India’s long-term water security challenge.
India’s very large population increases water demand across households, cities, agriculture, industry, and public services. Population size makes water management a national-scale challenge, especially where water stress and agricultural demand are already high. World Bank lists India’s 2024 population at about 1.45 billion, so 1.5B is a rounded display value.
India faces overlapping water pressures from demand, infrastructure, and climate variability.
Public datasets point to pressure across water availability, drinking water service conditions, and sectoral demand.
This profile should be read as a comparative public-data overview rather than a single harmonized statistical series.
Frequently Asked Questions
Yes. India faces a structural water-risk challenge, not just occasional water shortages. Water stress is high at 66.5%, agricultural water use is very high at 90.4% of total withdrawals, and drought exposure is Medium–High. This means pressure on India’s water resources can remain significant across seasons, especially where irrigation demand, groundwater use, and climate variability overlap.
India’s water stress is driven mainly by irrigation demand, very high agricultural water use, groundwater pressure, and climate variability. Agriculture accounts for 90.4% of total water withdrawals, making it the largest pressure point in India’s water profile. As a result, water risk in India is shaped not only by rainfall, but also by how water is used across farming, households, cities, and industry.
No. India has high basic drinking water access at 95.7%, but basic access does not mean every household receives water that is fully safe, reliable, and continuously available. Safely managed drinking water access is lower at 76.4%, showing that broad access and high-quality service are not the same. This gap makes water quality, reliability, and service management important parts of India’s water-risk profile.
Agriculture is central to India’s water risk because it accounts for 90.4% of total water withdrawals. This makes irrigation one of the main drivers of national water stress, especially in regions where farming depends on seasonal rainfall, groundwater, or large-scale irrigation systems. India’s water risk is therefore closely linked to food production, groundwater pressure, and the long-term sustainability of agricultural water use.
Sources
Methodology
This country profile combines World Bank API indicators with structured country feeds derived from JMP, AQUASTAT, and Aqueduct. Indicators come from different systems and years, so they should be interpreted together as a comparative public-data profile rather than a single harmonized statistical series.
FAO AQUASTAT SDG 6.4.2 water stress is a percentage-based national withdrawal indicator, while WRI Aqueduct baseline water stress is a separate risk-category system. These two metrics should be interpreted together, not treated as the same classification.Data confidence
Indicators may come from different years and sources and should be interpreted together as a comparative public-data profile rather than a single harmonized statistical series.